For years, the solar industry has leaned on a comfortable “standard”: 0.4% or 0.5% annual degradation. It is the general magic number that populates every spreadsheet, bankability report, and business cases of Local Authority.
However, as global fleet of assets ages, new research from 2024–2026 is exposing a harsh reality. There is a massive gap between Manufacturer Warranties and Field Reality, and it is called the “Long Tail” of Failure.
If you are managing utility-scale assets or advising on 30-year Power Purchase Agreement (PPA) structures, the “standard” model is no longer enough, for the following reasons:
- The UNSW “Long Tail” (2026)
New data from the University of New South Wales (UNSW) has identified that solar performance doesn’t always follow a neat, linear path. While the average might be 0.5%, approximately 20% of systems are “Long Tail” outliers.
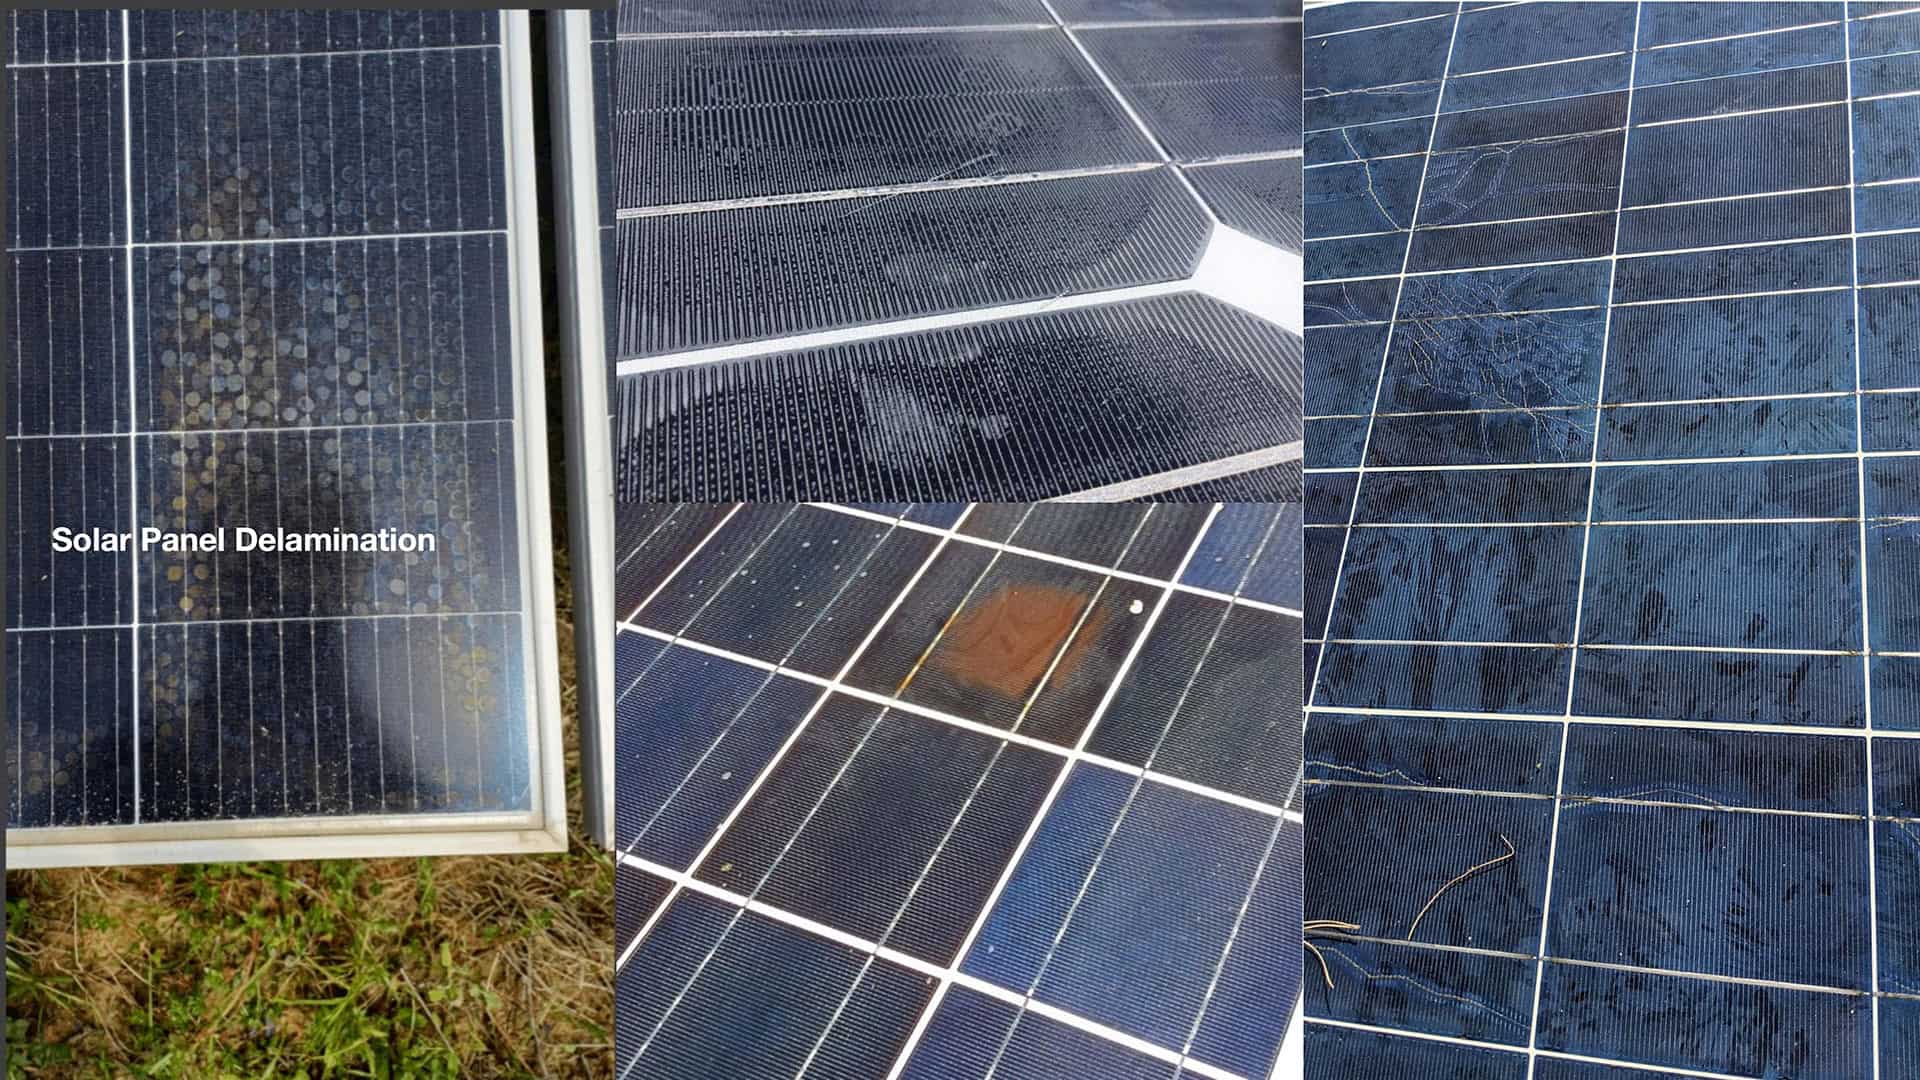
These assets degrade at 1.5x to 2.0x the predicted rate. This is not a minor dip; we are talking about potentially losing up to 45% of total output by Year 25 instead of the promised 15%. This is attributed to a “domino effect” where a single backsheet crack leads to moisture ingress, which triggers junction box corrosion and internal cell micro-cracks.
- The Year 20 “Cliff-Edge”
We used to think panels that made it to Year 15 were “safe.” A long-term study of monocrystalline modules (published in Solar Energy) monitored panels over 22 years of real-world exposure in Seville.
The findings? A 1.4% annual degradation rate; triple the standard assumption. Defects like metallization grid oxidation and “milky” encapsulant failures stay dormant for the first 15 years, then accelerate exponentially as materials hit their chemical fatigue limit.
- The N-Type & UV Trap
The shift to TOPCon (N-type) technology was supposed to solve degradation issues. However, NREL 2025 data have flagged a specific risk: Ultraviolet-Induced Degradation (UVID).
In some commercial systems, UVID has caused degradation of 2.4% per year. The “Tier 1” label does not provide a safety net, as current IEC 61215 standards only require minimal UV exposure for certification, which fails to simulate a 40-year cumulative UV load. UVID is most pronounced in regions of high temperatures such as in the tropics, which could be 3x to 6x faster than in temperate climates.
The Bottom Line for Asset Managers
Relying on a “0.4% consistent degradation” model for a 40-year project is an optimistic gamble, not a technical guarantee. To protect long-term ROI, there needs to be a shift toward:
- Replacement Reserves: Stop treating module replacement as an “if” and start treating it as a “when.”
- Performance Insurance: Hedging against the 20% probability of being a “Long Tail” asset.
- Advanced Diagnostics: Moving beyond visual checks to EL (Electroluminescence) imaging to catch the “domino effect” before the cliff-edge.
Is your current business case built on a 0.4% or 0.5% assumption? It might be time to stress-test your numbers.